News
Latest News and Stories
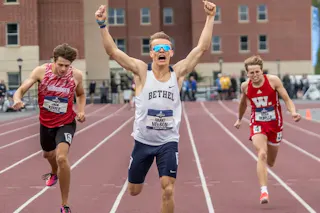
Spring athletics recap: Track and field leads strong season for Bethel athletics
Bethel’s 2026 spring season was highlighted by top-12 national finishes for both track and field programs, MIAC titles in baseball and men’s golf, historic tennis rankings, and record-setting individual performances.
June 11, 2026 | 10 a.m.
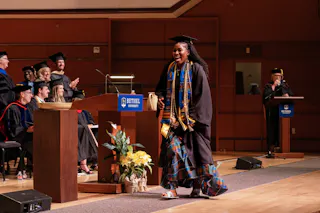
Different paths, shared purpose: Bethel celebrates spring commencement
Across Bethel’s undergraduate, graduate, and Seminary programs, commencement speakers challenged graduates to steward their education, faith, and calling in service of others.
June 05, 2026 | 9 a.m.

Alyssa Whetstone ’19 turns watercolor side hustle into thriving art business
After studying art and education at Bethel, Alyssa Whetstone ’19 expected to spend her career in the classroom. Instead, a watercolor hobby grew into a successful business centered on creativity, teaching, and helping others rediscover art.
June 04, 2026 | 1 p.m.
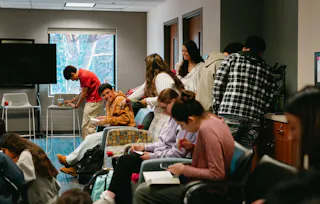
Kingdom Culture creates space for students to belong, worship, and celebrate culture at Bethel
Through Kingdom Culture, students are building communities where they can be known, supported, and shaped by one another’s stories.
June 03, 2026 | 12:30 p.m.
From Bethel to the Minnesota United sideline
Neil De Cleene ‘17 dreamed of working in professional sports. Today, he helps Minnesota United players stay healthy and recover from injury. His Bethel experience helped prepare him for the hands-on work of athletic training—and for the trust it takes to walk with players through a long season.
May 29, 2026 | 12:15 p.m.

Meet the 2026 Omark Preaching Competition winners
Josh King S’26, Logan Esposito S’26, Levi Case ’24, S’27, Marcus Knight S’26, and Emily Eagen ’26 are the winners of the 59th Edwin J. Omark Preaching Competition. This year in their sermons, students answered the question “What is the Gospel?”
May 27, 2026 | 10 a.m.

Bethel hosts Converge “170 Days of Prayer” simulcast leading up to denomination’s 170th anniversary
Students, pastors, church leaders, and community members gathered at Bethel University for an evening of worship and prayer celebrating the university’s longstanding partnership with Converge and a shared commitment to raising up future Christian leaders.
May 22, 2026 | 9:15 a.m.

Entering the special education classroom confident and prepared
One teacher’s decision to pursue licensure at Bethel has helped build a stable, supported special education team in rural Minnesota.
May 20, 2026 | 10:45 a.m.